


Link to previous
map
Methods of Comparison of Maps
1. Examination of the Original Maps
Each map has its own page which contains an image of the antique map overlaid with the modern outline of Orkney. These pages also provide other information relating to the maps together with map error diagrams indicating the location and magnitude of the errors on the maps. In the error diagrams, the length of each red line indicates how far a feature was displaced on the old map from its real location and is a measure of the positional error of the feature. Taken together, these errors were used to calculate an estimate of the overall error of the map. Details of these calculations are given in the following pages.
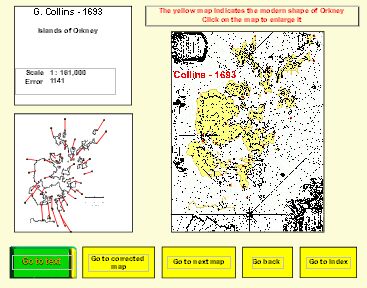
Name & Date
Map title
Scale &
Overall error
Error diagram
The red lines join real locations to squares at their positions on the old map
Illustration of original map with overlay of a modern outline in yellow.
Clicking on the map displays an enlarged version
Link to text relating to the map
Link to page showing the “corrected” map
Link to next map in the chronological sequence
Link to index of maps
Original Map